2.19. Self-Organized Criticality
Before this class you should:
Before next class you should:
Note taker: Sahibjot Chandla
2.19.1. Overview
This lecture introduces self-organized criticality (SOC), a concept used to explain why many complex systems naturally produce events of many different sizes.
SOC systems often exhibit several characteristic patterns:
fractal spatial structure
heavy-tailed distributions of event sizes
pink noise (1/f noise) in time series data
The lecture studies these ideas using the sand pile model, a simple system where local rules produce complex global behavior.
A side note mentioned during lecture: Professor Bogdan plays the baritone.
2.19.2. Critical Systems
A critical system operates near a transition between two different types of behavior. At this point the system becomes highly sensitive to disturbances.
Small perturbations can trigger responses of widely varying sizes. Because of this sensitivity, critical systems often display patterns that follow power laws and scale-free behavior.
Maintaining a system exactly at a critical point usually requires careful parameter tuning. However, many natural systems appear to remain near criticality without external control.
This idea leads to self-organized criticality (SOC).
- Self-organized criticality:
The tendency of some systems to naturally fluctuate toward it and remain near a critical state without external parameter tuning.
Instead of requiring careful adjustment of parameters, the internal interactions between elements of the system push it toward a state where instability and large cascades become possible.
The sand pile model introduced by Bak, Tang, and Wiesenfeld provides one of the simplest examples used to illustrate this behavior.
2.19.3. Sand Piles
The sand pile model introduced by Bak, Tang, and Wiesenfeld (1987) provides a simple abstraction for studying SOC.
The system consists of a two-dimensional grid where each cell stores an integer representing the amount of sand at that location.
A cell becomes unstable when the amount of sand exceeds the threshold:
When this occurs, the cell topples.
In general, the Sand Pile model can be represented from inheriting the Cell2D.py file:
class SandPile(Cell2D):

   def __init__(self, n, m, level=9):
      self.array = np.ones((n, m)) * level
This initializes a 2D grid where each cell starts with a fixed number of grains. The dynamics of the sand pile are implemented through a sequence of functions that model how sand is added and how the system relaxes.
The core of the model is the step function, which performs a single update
by toppling all unstable cells.
kernel = np.array([[0, 1, 0],
                   [1, -4, 1],
                   [0, 1, 0]])

def step(self, K=3):
    toppling = self.array > K
    num_toppled = np.sum(toppling)
    c = correlate2d(toppling, self.kernel, mode='same')
    self.array += c
    return num_toppled
The step function performs one update of the sand pile:
Identifies all cells above the threshold \(K\)
Counts how many cells will topple
Applies the toppling rule using a convolution kernel
Updates the grid and returns the number of topplings
This represents one time step in the system.
To simulate the full behavior of the system, we repeatedly apply step until
no more cells are unstable. This is handled by the run function.
def run(self):
    total = 0
    for i in itertools.count(1):
        num_toppled = self.step()
        total += num_toppled
        if num_toppled == 0:
            return i, total
The run function repeatedly applies step until the system stabilizes:
Calls
stepin a loopStops when no more cells topple
Returns the number of steps taken and total topplings
This simulates an entire avalanche until equilibrium is reached.
To drive the system, grains of sand are added one at a time. Each addition may
trigger an avalanche, which is then resolved by calling run.
def drop(self):
    a = self.array
    n, m = a.shape
    index = np.random.randint(n), np.random.randint(m)
    a[index] += 1
The drop function adds a grain of sand to the system:
Selects a random cell
Increments its value by 1
This is the external input that can trigger avalanches.
2.19.4. Toppling Rule
During a toppling event:
the unstable cell loses four grains of sand
each of its four neighboring cells gains one grain
These transfers may cause neighboring cells to become unstable, creating a cascade of toppling events called an avalanche.
Sand that would move outside the grid disappears, representing grains falling off the pile.
2.19.5. Implementing the Sand Pile
Simulations begin by initializing the grid with values above the toppling threshold and allowing the system to stabilize.
After stabilization, grains of sand are repeatedly dropped onto random cells. After each drop, the model runs until all cells become stable.
Two measurements are recorded for each avalanche:
- Avalanche duration \(T\):
The number of time steps required for the system to stabilize.
- Avalanche size \(S\):
The total number of toppling events during the cascade.
Most grains produce no avalanche, but occasionally a grain triggers a cascade affecting many cells.
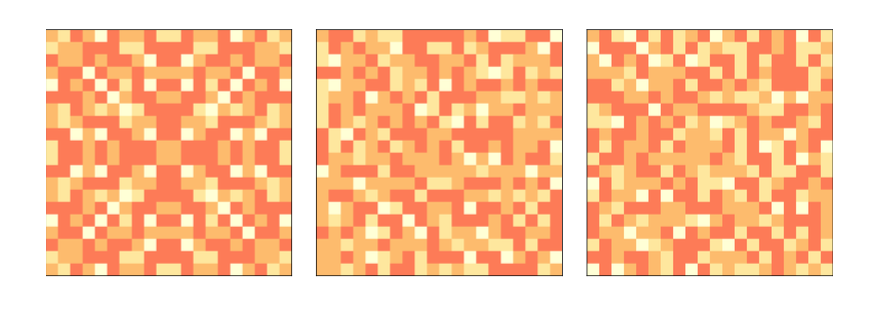
Sand pile configuration initially, after 200 drops, and after 400 drops.
Repeated grain additions gradually destroy the symmetry of the initial configuration and lead to a steady statistical state.
2.19.6. Heavy-Tailed Distributions
Avalanche statistics in the sand pile model follow heavy-tailed distributions.
- A heavy-tailed distribution:
A distribution where small events occur frequently while very large events remain possible.
The distributions of avalanche duration (\(T\)) and avalanche size (\(S\)) can be estimated from simulation data.
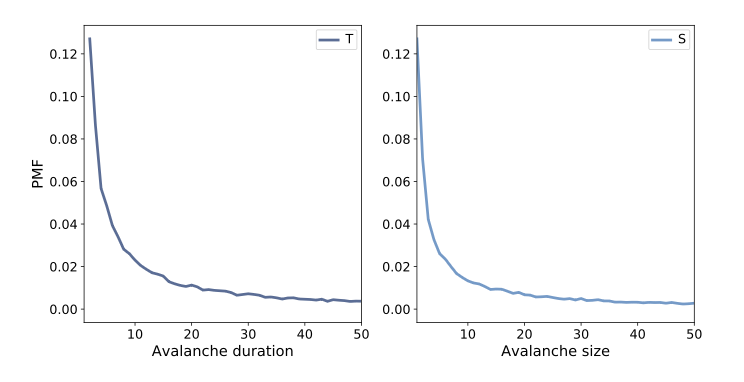
Distribution of avalanche duration and size on a linear scale.
Most avalanches are small, but larger ones still occur. The structure of the distribution becomes clearer when plotted on logarithmic axes.
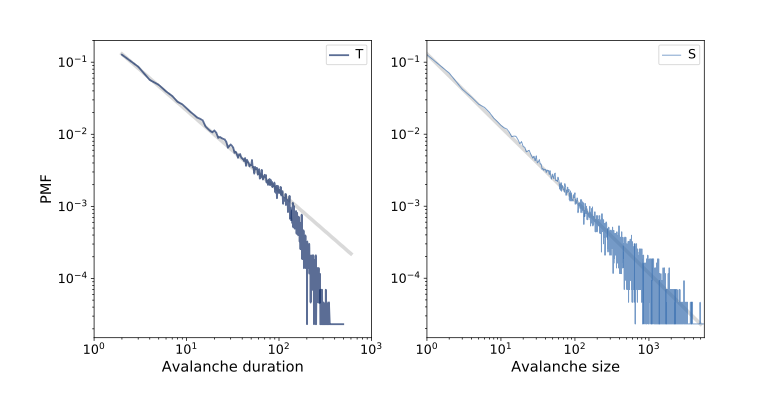
Log-log distributions of avalanche duration and size.
The approximate straight line on the log-log plot indicates a power-law distribution:
Power-law distributions are a common signature of systems near criticality.
2.19.7. Fractals
Critical systems often generate fractal spatial patterns.
- A fractal:
A geometric structure that exhibits self-similarity across different spatial scales.
In the sand pile model, cells with values 0, 1, 2, and 3 form structured patterns when the system reaches equilibrium.
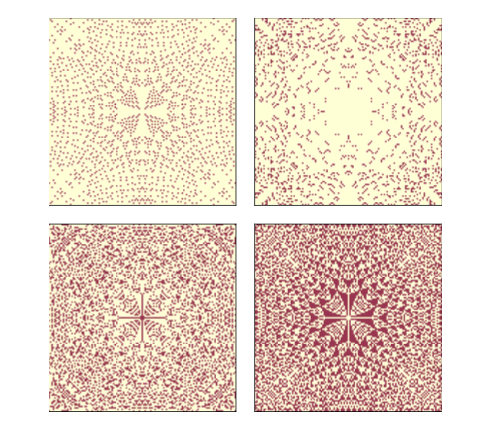
Cells with values 0, 1, 2, and 3 in the equilibrium configuration.
After the system reaches equilibrium, we can visualize the structure of the sand pile by examining the distribution of cell values.
def draw_four(viewer, levels=range(4)):
    thinkplot.preplot(rows=2, cols=2)
    a = viewer.viewee.array

    for i, level in enumerate(levels):
        thinkplot.subplot(i+1)
        viewer.draw_array(a == level, vmax=1)
This function helps reveal spatial patterns and fractal structure as seen in the figure.
To go beyond visual inspection, we can quantify these patterns using box-counting, which measures how structure changes with scale.
def count_cells(a):
    n, m = a.shape
    end = min(n, m)

    res = []
    for i in range(1, end, 2):
        top = (n - i) // 2
        left = (m - i) // 2
        box = a[top:top+i, left:left+i]
        total = np.sum(box)
        res.append((i, i**2, total))

    return np.transpose(res)
To test whether these patterns are fractal, we use the box-counting method.
- The box-counting method:
A technique that measures how the number of boxes required to cover a set changes as box size decreases. This is used to estimate the fractal dimension.
If the relationship follows a power law, the structure has a fractal dimension.
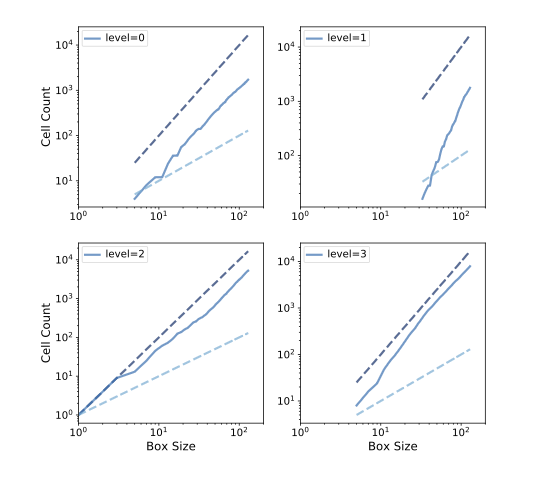
Box-counting results for each cell level.
The approximately linear relationships in the log-log plots indicate that the equilibrium patterns have fractal characteristics.
2.19.8. Pink Noise
The original SOC paper was subtitled “An Explanation of 1/f Noise”.
- A signal:
Any quantity that varies over time.
In the sand pile model, the number of cells that topple at each time step forms a signal.
- A power spectrum:
A function describing how signal power is distributed across frequencies.
Different types of noise follow different frequency relationships.
White noise:
Equal power at all frequencies.
Red noise:
Pink noise:
More generally:
Signals with \(\beta \approx 1\) are classified as pink noise.
2.19.9. The Sound of Sand
If we record the number of cells that topple at each time step, we obtain a time series representing the activity of the sand pile.
The power spectrum of this signal can then be computed.
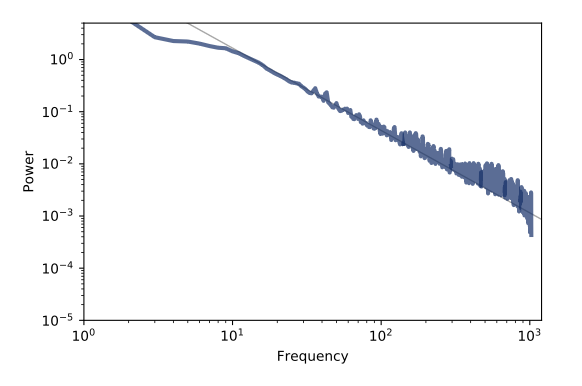
Power spectrum of sand pile activity over time.
The approximately linear trend on the log-log plot indicates a power-law relationship between frequency and power, consistent with pink-noise behavior.
2.19.10. Reductionism and Holism
The sand pile model illustrates two approaches to scientific modeling.
- Reductionism:
Explains systems by modeling detailed interactions between individual components.
- Holism:
Focuses on whether a simplified model can reproduce important large-scale behaviors.
The sand pile model does not attempt to replicate real sand exactly. Instead, it identifies minimal rules capable of generating critical behavior.
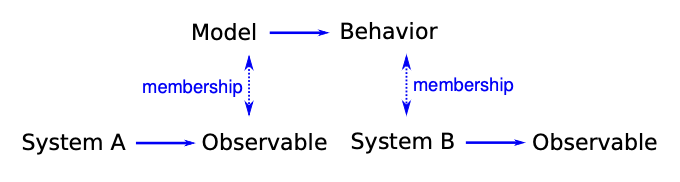
Logical structure of a holistic model.
2.19.11. SOC, Causation, and Prediction
Self-organized critical systems challenge simple ideas about causation.
In such systems, a small disturbance can trigger events of widely different sizes.
Examples include:
Earthquakes
Financial market crashes
Failures in large engineered systems
Two types of causes are often distinguished.
- Proximate cause:
The immediate trigger of an event.
- Ultimate cause:
The deeper structural conditions that allow the event to occur.
In the sand pile model, the proximate cause of an avalanche is the grain of sand that initiates it. The ultimate cause is the critical organization of the entire system.
2.19.12. Summary
Self-organized criticality describes systems that naturally evolve toward a critical state where events of many different sizes can occur.
The sand pile model shows how simple local rules can generate heavy-tailed avalanches, fractal spatial patterns, and pink-noise temporal behavior. These properties appear in many natural and engineered systems.