2.8. Lecture 7: Graphs
Before this class you should:
Read Think Complexity, Chapter 2
Read the Wikipedia page about graphs at https://en.wikipedia.org/wiki/Graph_(discrete_mathematics) and answer the following questions:
What is a simple graph? For our discussion today, we will assume that all graphs are simple graphs. This is a common assumption for many graph algorithms – so common it is often unstated.
What is a regular graph? What is a complete graph? Prove that a complete graph is regular.
What is a path? What is a cycle?
What is a forest? What is a tree? Note: a graph is connected if there is a path from every node to every other node.
Before next class you should:
Read Think Complexity, Chapter 3
Read the Wikipedia page on the Small-world Experiment https://en.wikipedia.org/wiki/Small-world_experiment
Read Watts and Strogatz “Collective Dynamics of ‘small world’ networks” http://www.nature.com/nature/journal/v393/n6684/full/393440a0.html
Note taker: James Watt
2.8.1. Overview
This lecture introduces graphs as mathematical structures used to represent relationships between objects. Topics covered include:
Basic terminology (nodes, edges, neighbors, degree)
Common graph classes (simple, regular, complete)
Paths, cycles, and closed walks
Trees and forests
NetworkX (Python) graph construction and visualization
Complete graphs and random graphs in NetworkX
Breakout room activity: prerequisite and task-dependency graphs
2.8.2. Definitions
A graph consists of a set of nodes (vertices) and edges connecting pairs of nodes.
Node (vertex): An element of the graph representing an entity (e.g., a person or a city).
Edge: A connection between two nodes representing a relationship or interaction.
Neighbors: Two nodes are neighbors if they are connected by an edge.
Degree: The number of edges incident to a node (equivalently, the number of neighbors in an undirected graph).
Simple graph: An undirected graph with no loops and no multiple edges.
Regular graph: A graph in which every node has the same degree.
Complete graph: A graph in which each pair of distinct nodes is joined by an edge. Each node is connected by an edge to every other node. For a complete graph with \(N\) nodes, each node has degree \(N-1\). Therefore, every node has the same degree, which implies the graph is regular (the reverse is not always true: a regular graph is not necessarily complete).
2.8.4. Trees and forests
Tree: A connected graph with no cycles.
Forest: A graph with no cycles (a disjoint union of one or more trees).
A graph is connected if there exists a path between every pair of nodes.
2.8.5. Case study: COVID-19 contact tracing
Contact tracing can be modeled using a graph to visualize and analyze how interactions between individuals may contribute to disease spread.
Nodes represent people
Edges represent interactions (who interacts with whom)
Edges can be weighted to represent interaction level (weighted edges)
2.8.6. NetworkX (Python)
NetworkX is a Python package used to create, manipulate, and study graphs.
2.8.6.1. Imports and setup
import matplotlib.pyplot as plt
import networkx as nx
import numpy as np
import seaborn as sns

from utils import decorate, savefig

np.random.seed(17)
2.8.6.2. Set the color palette
colors = sns.color_palette("pastel", 5)
sns.set_palette(colors)
2.8.6.3. Directed graphs
This example represents a directed social network with three nodes.
How to add nodes:
G = nx.DiGraph()

G.add_node("Alice")
G.add_node("Bob")
G.add_node("Chuck")

list(G.nodes())
How to add edges:
G.add_edge("Alice", "Bob")
G.add_edge("Alice", "Chuck")
G.add_edge("Bob", "Alice")
G.add_edge("Bob", "Chuck")

list(G.edges())
How to draw the graph:
draw_circulardraws the nodes in a circleThis also shows how to create a PDF output
nx.draw_circular(G, node_color="C0", node_size=2000)
plt.axis("equal")
savefig("chap02-1.pdf")
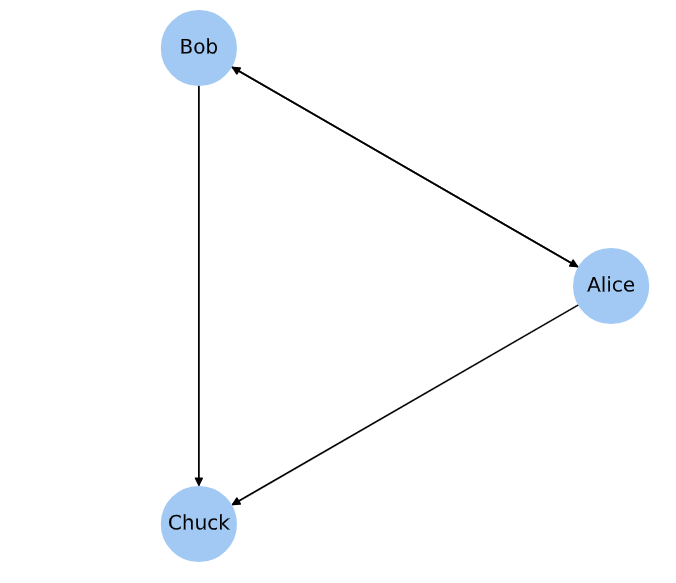
Directed graph example (corresponds to chap02-1 output).
2.8.6.4. Undirected graph example
positionsmaps each city to its coordinatesKeys in
positionscan be used to add nodes to the graphdrive_timesmaps pairs of cities to driving times between them
positions = dict(Albany=(-74, 43), Boston=(-71, 42))

positions["Albany"]

G = nx.Graph()
G.add_nodes_from(positions)
G.nodes()
drive_times = {
    ("Albany", "Boston"): 3,
    ("Albany", "NYC"): 4,
    ("Boston", "NYC"): 4,
    ("NYC", "Philly"): 2,
}

G.add_edges_from(drive_times)
G.edges()
nx.draw(G, positions, node_color="C1", node_size=2000)
nx.draw_networkx_edge_labels(G, positions, edge_labels=drive_times)
plt.axis("equal")
savefig("chap02-2.pdf")
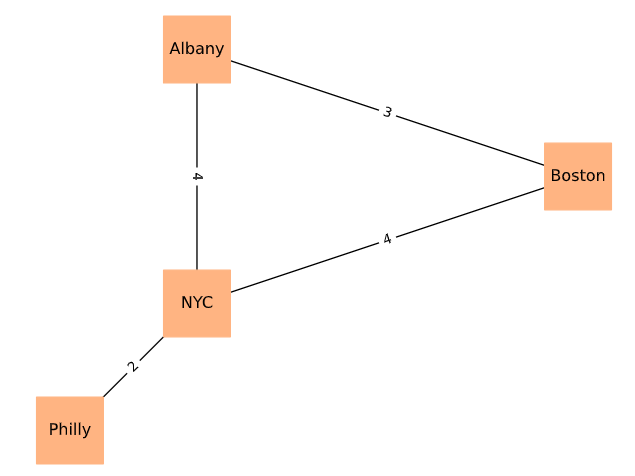
Undirected graph example with edge labels (chap02-2 output).
2.8.6.5. Complete graphs
A complete graph can be generated by creating edges between all pairs of nodes.
The function uses yield, which makes it a generator, producing edges one at
a time.
def all_pairs(nodes):
    for i, u in enumerate(nodes):
        for j, v in enumerate(nodes):
            if i < j:
                yield u, v
def make_complete_graph(n):
    G = nx.Graph()
    nodes = range(n)
    G.add_nodes_from(nodes)
    G.add_edges_from(all_pairs(nodes))
    return G
Example:
complete = make_complete_graph(10)
complete.number_of_nodes()
The neighbors method returns the neighbors for a given node:
list(complete.neighbors(0))
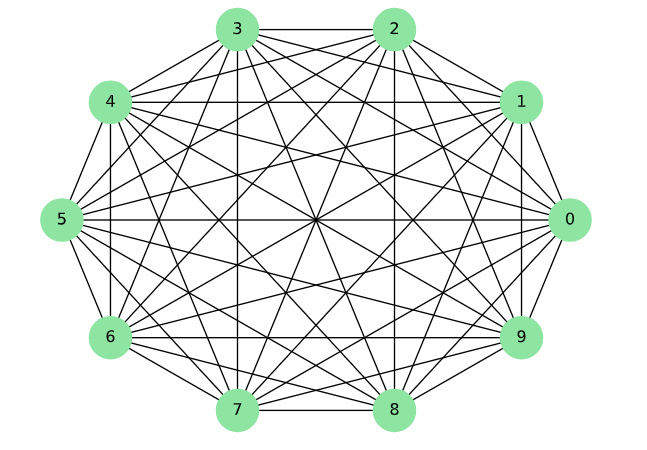
Complete graph example (chap02-3 related output).
2.8.6.6. Random graphs
Random graphs can be generated by including each possible edge with a fixed probability \(p\).
The helper function flip returns True with probability \(p\) and False
with probability \(1-p\).
def flip(p):
    return np.random.random() < p
def random_pairs(nodes, p):
    for edge in all_pairs(nodes):
        if flip(p):
            yield edge
def make_random_graph(n, p):
    G = nx.Graph()
    nodes = range(n)
    G.add_nodes_from(nodes)
    G.add_edges_from(random_pairs(nodes, p))
    return G
Example:
np.random.seed(10)
random_graph = make_random_graph(10, 0.3)
len(random_graph.edges())
nx.draw_circular(random_graph, node_color="C3", node_size=2000)
plt.axis("equal")
savefig("chap02-4.pdf")
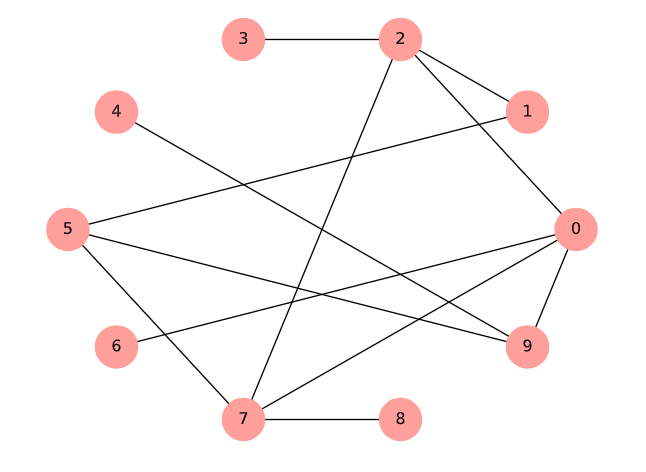
Random graph example (chap02-4 output).
2.8.7. Breakout rooms activity
The server stopped working, so the class switched to breakout rooms.
Breakout room roles:
One member drawing
One member programming
One member presenting
2.8.7.1. Group A + C: Course prerequisite graph
Tasks:
Draw/program the directed graph
Does the graph contain a cycle?
What is the longest prerequisite chain?
Assuming 1 course per semester, what is the minimum number of semesters needed to complete all courses?
Group A results:
No cycle, because there is no path that leads back to a previously visited node.
Longest prerequisite chain: Math1210 -> Engg3130 (5 semesters)
Minimum time to complete all courses: 6 semesters
2.8.7.2. Group B + D: Task dependency graph
Tasks:
Draw/program the directed graph
Identify bottleneck tasks
Find the longest chain
Which task failure would delay the most downstream tasks?
Group B results:
Bottleneck task: where multiple processes are waiting for a task to complete; for this graph it would be “run the integration tests”
The starting point does not count as a bottleneck because prior tasks are not shown
Task failure that causes the most downstream issues: “install”
2.8.8. Announcements
A post is going up today about the lab test:
10 peers for 20 minutes
Jupyter notebook, 4 questions
Up until next Thursday
Small-world graphs (lower probability)
Coding question, then a written part
Link to Lab 1 test tutor posting after class
2.8.9. Note
At this point in the course, the textbook reading matters, and the lecture assumes students arrive prepared.